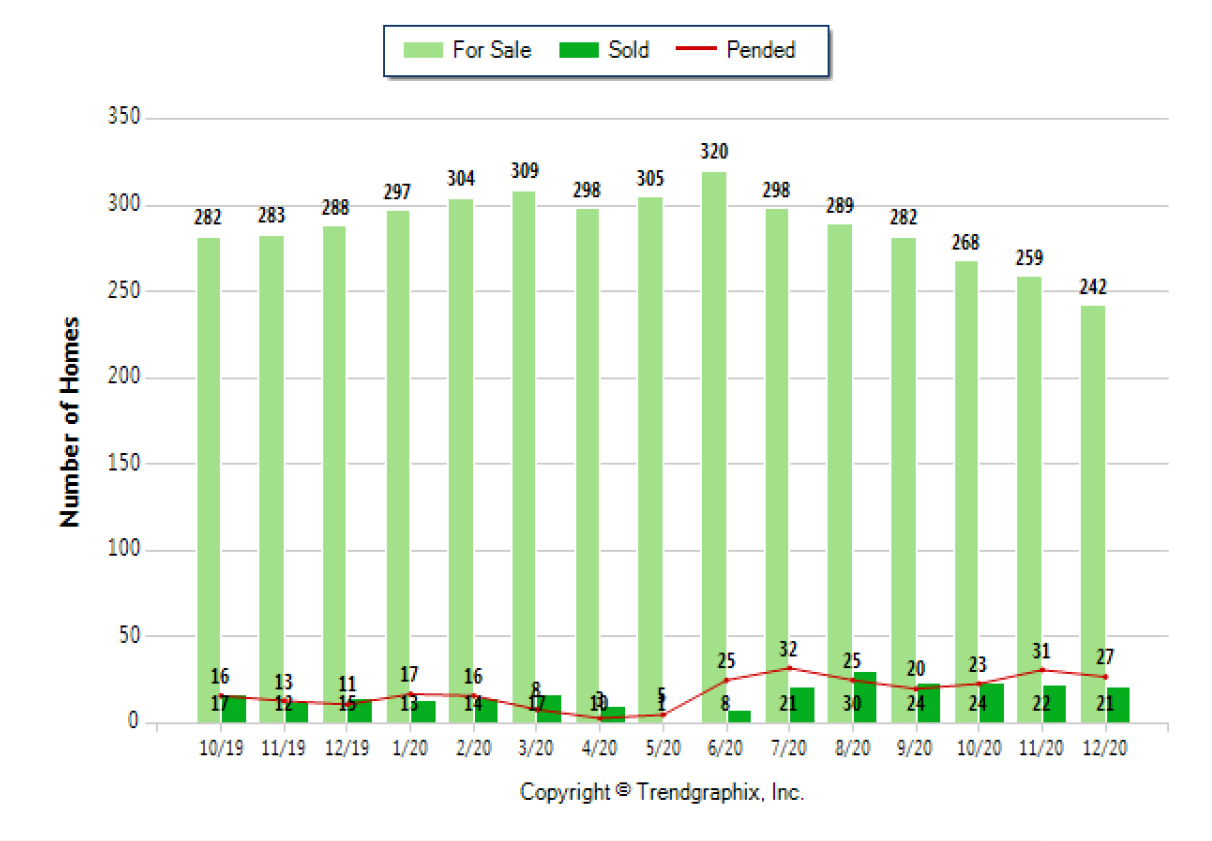
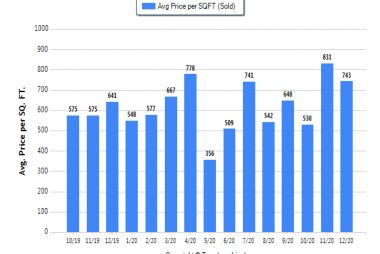
I am going to share with you five graphs that reflect fifteen months of market activity. However, we will focus on annual numbers and percentages.
From one year ago, the number of active listings for condominiums in Key Biscayne, Florida, is down 16% while the sold properties are up 40%.
The pended listings are up 145%. When the PENDED LISTINGS indicator is rising, our market is in recovery. That means, contracts have been written and are anticipated to close.
Average condo prices are up. The average price per square foot of a Key Biscayne condo is approximately $743 per square foot – which is an increase of 15.9% over last year.
Condos remain on the market an average of 204 days or a tad over six months. That may sound like a lot, but it is actually a decrease of 8.9% over last year!
Condos are selling within 92% of their originally listed price.
The average listed price in Key Biscayne is $1,496,000 — a 9.9% increase over last year. The average sold price is $1,295,000.
Now let’s take a look at months of Inventory. Currently, Key Biscayne is experiencing 11.5 months of inventory which is indicative of a Buyer’s market – however, this is a 40.1% decrease from a year ago which means there are still fewer homes to pick from!
The reason for the shortage of inventory is that many homeowners pulled their condos off the market during 2020, and we have more buyers desiring to live in our paradise known as Key Biscayne!
If you would like to download all five graphs, please do!
You can also watch my video that is the subject of this post!
